
How to Track Student Progress During Live Practice
The best moment to help a student is the moment they get stuck — not when you hand back marking the next day. By then the lesson has moved on, the confusion has set, and you're reteaching from cold. Live practice fixes the timing: while students answer on their own devices, you can see who's flying, who has stalled and who has quietly given up, and step in before a small wobble becomes a fixed misconception. This article is about reading those signals and, more importantly, acting on them in the moment.
What "live" actually gives you
In a live practice session, students work through questions on their own devices and get instant right/wrong feedback with points. You choose teacher-paced (everyone moves together) or self-paced (each student at their own speed). Either way, the value for you isn't the answering — it's the visibility. Instead of circulating and glancing over shoulders, you get a single view of the whole class updating as they work.
That view is the Live Student Grid, part of the Teacher Plus and School plans. Students always join free with a class code; the grid is the teacher-side window onto what they're doing.
Reading the live student grid
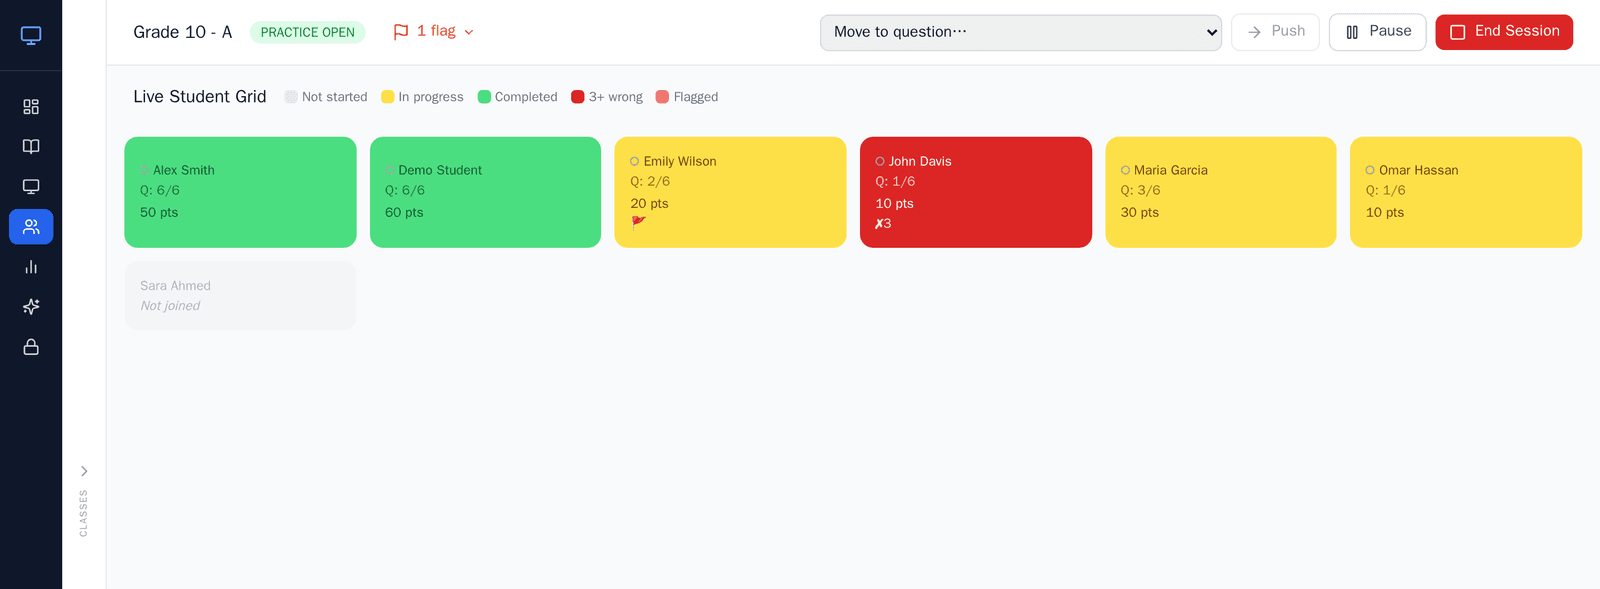
The grid gives you a tile per student, each carrying a few honest signals. It shows status and progress — it doesn't diagnose why a student is struggling or do any automated "gap analysis". That interpretation is your job; the grid just makes the raw signals easy to read at a glance.
- In progress vs completed. See who's still working and who has finished, so you know whether the class is ready to move on or half of them are still on question three.
- A "struggling" signal. When a student gets repeated wrong answers on the same question, their tile flags it. That's your cue to look closer — it might be one tricky item, or a misconception worth addressing with the whole room.
- Help flags. Students can raise a one-tap flag to ask for help without putting a hand up or interrupting — a quieter, lower-stakes way for the less confident ones to signal they're stuck.
- Questions completed and current score. Each tile shows how far through the set a student is and how they're doing, so pace and performance sit side by side.
- Click for attempt history. Tap a student to see exactly what they tried on each question. This is where you learn whether a wrong answer was a slip or a genuine misunderstanding.
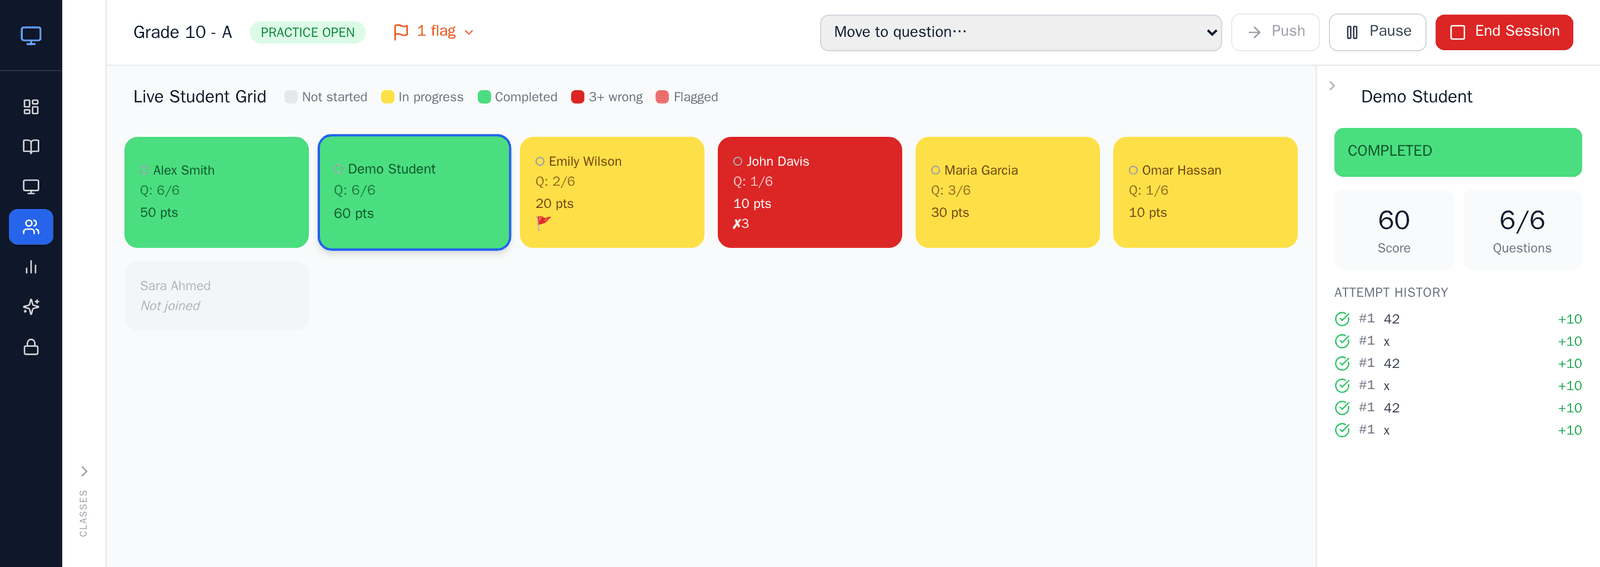
You can also fold the panel away for a clean full-class view when you want the overview rather than the detail. The grid updates live as students work, with a short auto-refresh fallback if a connection hiccups, so the picture stays current without you refreshing anything.
Presence and pacing
Alongside status, each tile carries a presence dot: online, away or offline. That's more useful than it sounds. In a self-paced session, an "away" dot next to a half-finished set tells you a student has drifted — off-task, or stuck and avoiding it. An offline dot on a remote learner might mean a dropped connection rather than a lack of effort, worth knowing before you draw conclusions about progress.
Presence also helps you pace. Running teacher-paced with most dots online and most tiles "completed"? Move on with confidence. If a cluster is still in progress, hold the line for thirty seconds rather than leaving a third of the class behind. Reading presence and progress together keeps the whole room roughly in step without nagging individuals.
Turn the signal into action
The grid is only worth having if it changes what you do next. The point isn't to admire a live readout — it's to intervene earlier and more precisely than you otherwise could. Three moves cover most situations.
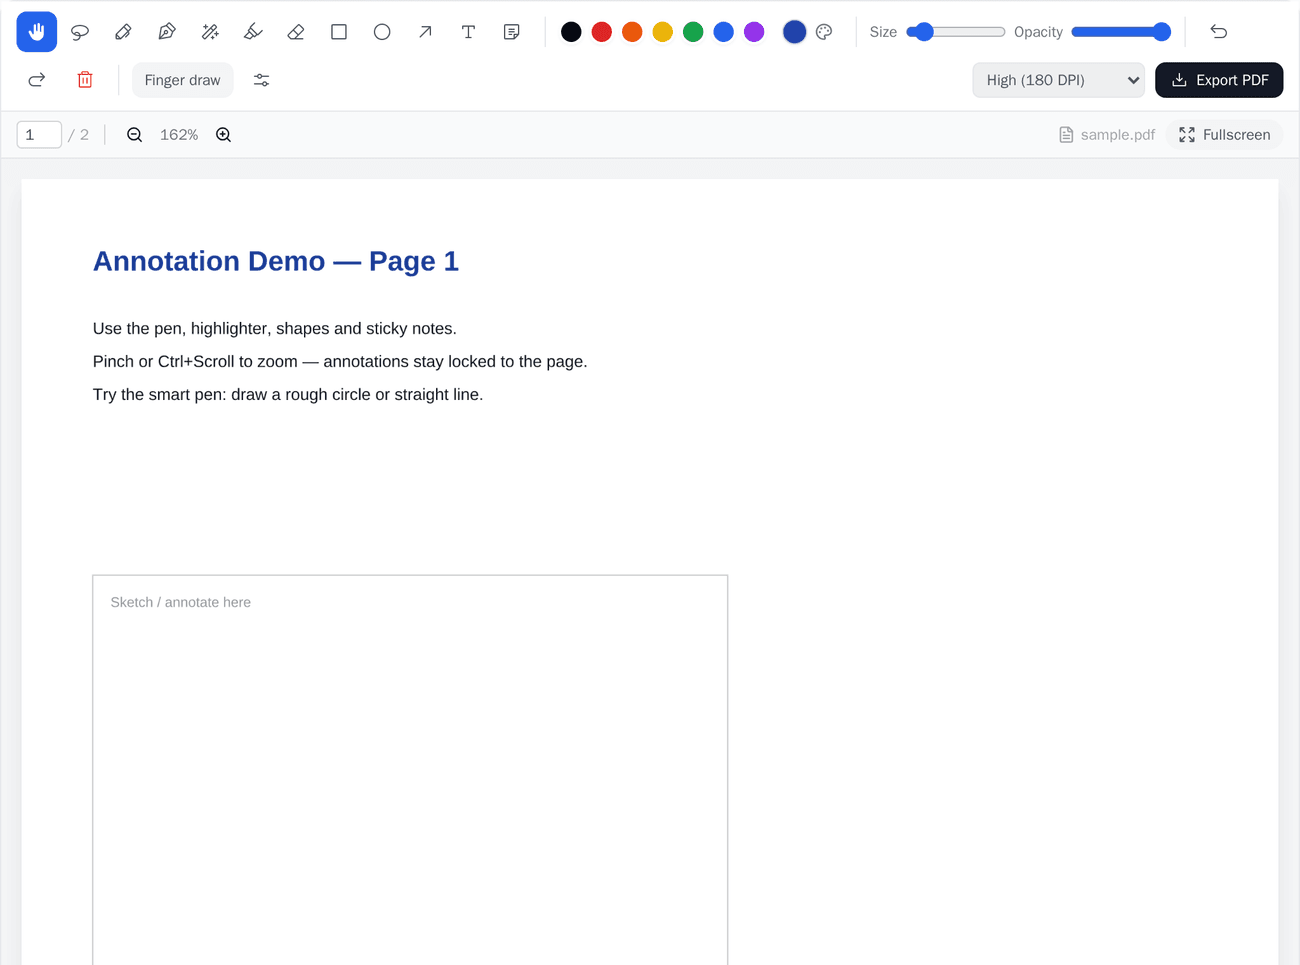
- Spot a common mistake, then reteach. If several tiles flag struggling on the same question, that's a whole-class signal. Pause, switch to the smart board and work the problem through full-screen, annotating live. With follow-me page sync the class sees exactly what you're drawing, and you can push a fresh question or short practice mid-lesson to check the fix landed.
- Target individuals. A lone struggling flag or help flag is a one-to-one cue. Open that student's attempt history, see what they tried, and have a quick targeted word — or send an easier item — without stopping everyone else.
- Adjust the pace. If most of the class has completed and scores look solid, move on. If progress is uneven, slow down, hold the next question, or give fast finishers an extension while the rest catch up. The grid gives you the evidence to call it in real time rather than guessing.
The common mistake: watching instead of acting
The biggest trap with a live view is treating it like a dashboard — something to monitor rather than act on. It's satisfying to watch tiles tick over to "completed" and scores climb, and easy to spend a whole session just observing. But a struggling flag you noticed and ignored is worse than no flag at all, because the student stayed stuck while you watched. Make it a habit: every flag or stall gets a response within a minute or two, even if it's just "I'll come to you next". The grid earns its place by shortening the gap between a student struggling and you helping — not by giving you something to look at.
After the lesson: reports
Live signals are for the moment; reports are for the longer view. Once the session ends you get a per-session breakdown — completion, average and first-try accuracy — plus per-student and per-question detail showing which items tripped people up. The sessions log keeps a record over time, and a score-trend chart shows whether a class or individual is climbing or sliding. Export to CSV to keep your own records or share with a colleague.
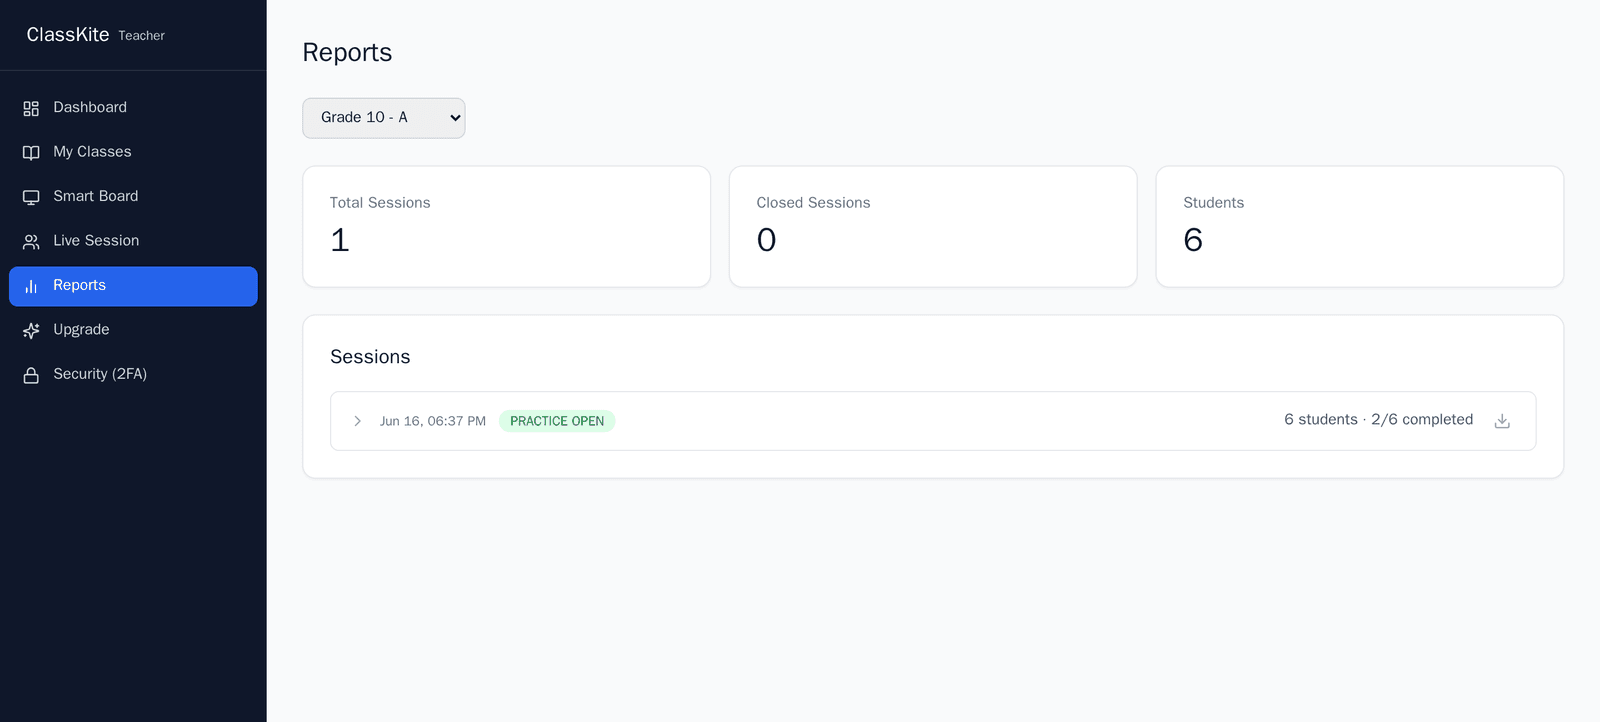
As with the grid, reports show the numbers — not the cause. There's no automated learning-gap analysis here; you read the per-question accuracy, notice everyone missed the same item, and decide it needs revisiting. The tool surfaces the evidence and you make the teaching judgement. Reports are part of the same Plus and School plans.
In the classroom
Here's an illustrative example of how this hangs together. A Year 9 maths teacher runs a self-paced practice on solving equations. A few minutes in, three tiles flag struggling on the same two-step question. She opens one student's attempt history and sees they're subtracting before dividing — a classic order-of-operations slip. Rather than fix it three times, she pauses the class, pulls up the question on the smart board, and works it through with live annotation so everyone sees the correct order. She pushes one more two-step question to check it stuck, watches the tiles turn green, and lets the class carry on. After the lesson she glances at the per-question report, notes that item still had the lowest accuracy, and pencils in a quick recap next week. None of that needed marking; all of it happened while it still mattered.
Frequently asked questions
What does the grid show me?
A tile per student with their status (in progress, completed or flagged), a struggling signal when they repeatedly get the same question wrong, any help flags they raise, an online/away/offline presence dot, and their questions completed and current score. Click a student for their full attempt history. It shows status and performance; it doesn't diagnose why a student is struggling — that interpretation is yours.
Is it really real-time?
Yes. The grid streams updates live as students answer, so the picture stays current without you refreshing. If a connection briefly drops, a short auto-refresh fallback keeps things up to date, so you're never looking at a stale screen for long.
How do I act on a struggling signal mid-lesson?
If it's one student, open their attempt history to see what they tried and have a quick targeted word. If several flag the same question, treat it as a whole-class signal: pause, switch to the smart board, reteach the problem with live annotation and follow-me page sync, then push a fresh question to check the fix landed.
Which plans include the live student grid?
The Live Student Grid and reports are part of the Teacher Plus and School plans. Students always join practice free with a class code. Compare what each plan includes on the pricing page, and schools can read more about seats and admin on the schools page.
Try it in your next lesson
The real test is a live class. Run one practice session with the grid open, commit to responding to every flag within a minute, and see how different the lesson feels when you help students as they struggle rather than the day after. You can sign in to get started or compare features and plans on the pricing page. To see how other teachers fit this into their routine, our guide to using ClassKite step by step walks through a full lesson.
Written by the ClassKite team and reviewed by a practising teacher.